For plants that finally argue about the same number
Manufacturing Data & Analytics
A plant rarely lacks data, it lacks agreement on what the data means once it leaves the shop floor. This practice builds sensor pipelines, standardises OEE reporting across plants, and integrates shop-floor systems with enterprise planning. A shared definition, agreed before a dashboard exists, is the actual deliverable.
How a cross-plant OEE definition gets agreed here
Sensor pipelines, shared metric definitions and the MES-to-ERP integration underneath them.
 90 secSample frame · video pending
01Before a pipeline gets built
Real-time dashboards or nightly batch reporting is a real decision.
Real-time gets requested by default, often before the infrastructure or the organisation is ready for it. Four questions settle which one actually fits.
How fast does a problem actually need attention?
A line that can tolerate a delayed response is served well by nightly batch reports. A line where minutes matter needs real-time data instead.
Is the shop-floor infrastructure ready for real-time data?
Real-time reporting needs sensors and networks that can actually stream continuously. Older equipment often needs a retrofit before real-time is realistic.
What is the cost of the infrastructure either way?
Batch reporting runs on infrastructure most plants already have. Real-time dashboards typically require investment in streaming and storage most plants have not made yet.
Is the organisation ready to act on a real-time alert?
A real-time alert nobody is staffed to act on just adds noise. Batch reporting is safer until an actual response process exists.
| Real-time dashboards | Nightly batch reporting | |
|---|---|---|
| Infrastructure needed | Streaming sensors and networks | Standard batch collection |
| Cost | Higher, ongoing investment | Lower, uses existing systems |
| Best for | Lines where minutes matter | Most steady-state reporting needs |
| Organisational readiness | Needs a live response process | Fits a standard reporting cadence |
02Agreed before the build starts
The ledger that keeps a manufacturing data build honest
Manufacturing data engagements go wrong when access to shop-floor data or the definition of a shared metric gets assumed rather than agreed. The boundary below fixes what you supply, what gets engineered, what you receive, and what stays under your ownership throughout.
- Your side
You bring
- The sensors and shop-floor systems already generating data
- Where that data currently lands, if anywhere at all
- The decisions plant managers actually need it to support
- Our side
We build
- A pipeline connecting operational technology to IT systems that can use it
- Data normalised across equipment from different vendors and eras
- Quality checks that catch a broken sensor before a report hides it
- Your side
You receive
- A production pipeline where shop-floor data finally reaches a usable system
- Dashboards built around decisions plant managers actually make
- A path for adding new equipment without a pipeline rebuild
Never leaves you
- Ownership of the underlying production and sensor data
- Authority over which systems can access shop-floor data
- The relationship with equipment vendors and their own data tools
Where the line sitsWe connect the shop floor to IT systems; you keep control over who is allowed to see that data once it moves.
03From a sensor reading to a plant comparison
Four stages, each closing on evidence
Manufacturing data builds that go unused usually skipped a stage here. This system closes each one with something a plant manager could actually rely on.
Agree what each metric actually means
OEE, quality and utilization definitions are agreed across every plant involved before a single dashboard gets designed, so numbers can actually be compared.
Definitions agreed before a dashboard existsBuild the pipeline across operational and IT systems
The pipeline is built to move data cleanly between operational technology on the floor and the IT systems that need to use it.
Built to connect OT and IT cleanlyValidate against real sensors and real shifts
The pipeline and reporting are tested against live sensor feeds and real shift patterns, not a clean sample that hides equipment quirks.
Checked against real shop-floor conditionsShip with drill-down, not just a summary number
Every plant-level number ships with a way to drill down to the shift or machine behind it, so a manager can actually act on what it shows.
Live with a way to trace a number back
04What actually moves the number
Four drivers, priced from the assessment
Manufacturing data work is priced against the scoping assessment, because these four factors change effort by multiples.
Number of plants and equipment vendors involved
A single plant with one equipment vendor costs far less to standardise than several plants running different, older systems.
Real-time infrastructure versus batch reporting
Batch reporting on existing infrastructure costs less than real-time dashboards requiring new streaming and storage investment.
Number of enterprise systems the pipeline must reach
One MES feeding one ERP is simpler than a pipeline synchronising several shop-floor systems with multiple enterprise platforms.
Consistency of existing metric definitions
Plants already using a shared definition cost less to unify than ones that have measured the same metric differently for years.
05Evidence and proof
Data proof is two plants finally arguing about the same number.
Manufacturing data proof is a shared definition and a reconciliation that stopped happening by hand. Every record here waits for written client approval before production.
Explore case studiesOEE reporting made three plants comparable for the first time.
Nexa Foundry's three plants each calculated equipment effectiveness differently, so leadership could not compare them fairly. A shared definition and reporting layer made the numbers finally mean the same thing.
- Plants on a shared OEE definition
- 3
- Cross-plant comparison
- Now possible
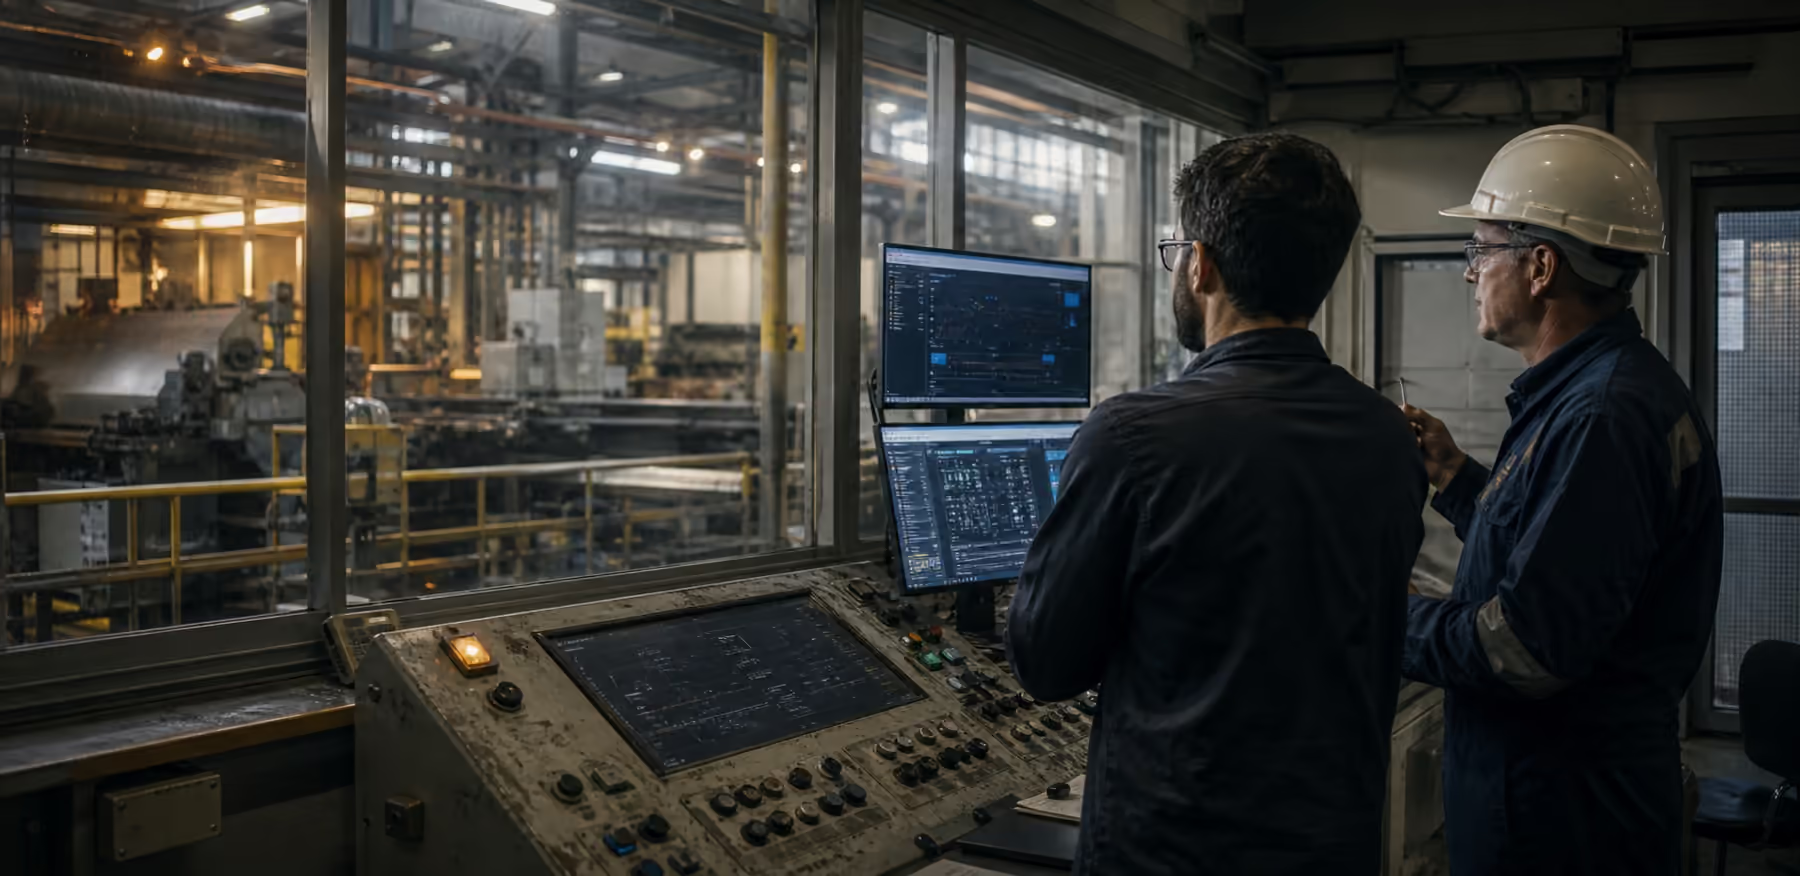
An MES-to-ERP integration ended a monthly manual reconciliation.
Koru Health's production numbers and enterprise planning system disagreed every month until someone reconciled them by hand. An integration synchronised the two automatically, removing the manual step.
- Monthly manual reconciliation hours
- Eliminated
- Production-to-planning data agreement
- Automatic
For the first time, two plant managers are arguing about the same number instead of two different ones.
Sample · pending client approval

06Read this first
When a full data platform is the wrong answer
Building a cross-plant data platform for a single line with one supervisor tracking results by hand is over-engineering. The exits are marked plainly. When a build is justified, it runs on standard industrial data protocols and integrates with the MES and ERP systems you already operate.
- Data practice
You run one line and already track results by hand
A shared spreadsheet or a supervisor's own log often covers a single line faster than a commissioned data platform.
- Product discovery
Plant leadership hasn't agreed on shared definitions yet
Building reporting on undefined metrics just automates disagreement faster. Settle the definitions first, then build the pipeline.
- Team extension
You need data engineers, not a delivery team
When your team already owns the data roadmap and just needs extra hands, team extension fits better than a commissioned build.
| Shape | Best when | You direct | We carry |
|---|---|---|---|
| Scoped build | Definitions and scope are settled | Metric definitions and access | Pipeline design and delivery |
| Delivery pod | Reporting needs will keep evolving | Product priorities each cycle | Engineering and integration work |
| Team extension | Your leads own the data strategy | Roadmap and standards | Named engineers and continuity |
07Straight answers
Asked before a manufacturing data budget is approved.
01How do you connect shop-floor sensors to our IT systems?
A pipeline is built to move data cleanly from operational technology on the floor into the IT systems that need it. Data gets normalised across equipment from different vendors and eras.
02Can you make OEE comparable across multiple plants?
Yes, a consistent definition of availability, performance and quality is agreed across every plant involved. Reporting is built so one plant's number can be compared fairly with another's.
03Do you integrate our MES with our ERP system?
Yes, production data is synchronised with enterprise planning systems so the two finally agree. Error handling covers the mismatches real shop-floor and ERP data actually contain.
04Should we build real-time dashboards or start with batch reports?
Start with batch reporting unless minutes genuinely matter for the decision involved. Real-time dashboards need streaming infrastructure most plants have not invested in yet.
05What does manufacturing data work cost?
Priced against the number of plants and vendors involved, whether reporting is real-time or batch, and how many enterprise systems it must reach, from the scoping assessment. Batch reporting typically costs less.
06Can we drill down from a plant number to a specific machine?
Yes, every plant-level number ships with a way to trace it back to the shift or machine behind it. A summary number alone is not the deliverable.
07Who decides what counts as acceptable equipment effectiveness?
Your team does. The reporting layer surfaces the number; the standard for what counts as acceptable stays a production decision you own.
08How is this different from the AI work you do in manufacturing?
This practice builds the data infrastructure underneath, including pipelines, OEE reporting and system integration. Predictive models and vision inspection sit on top of that same infrastructure.