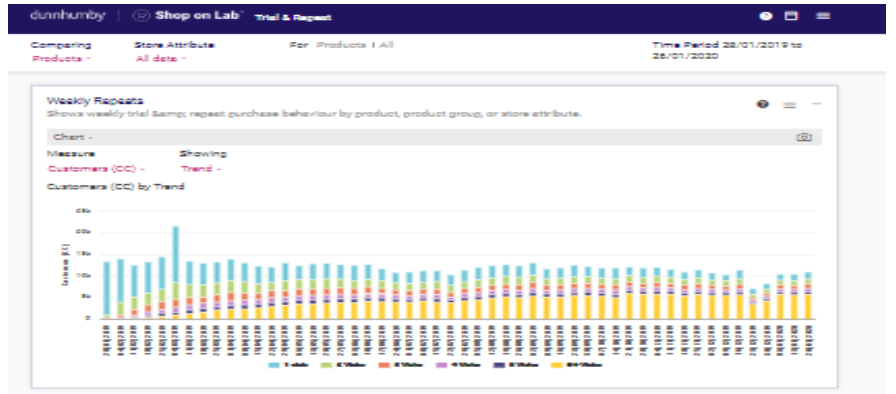
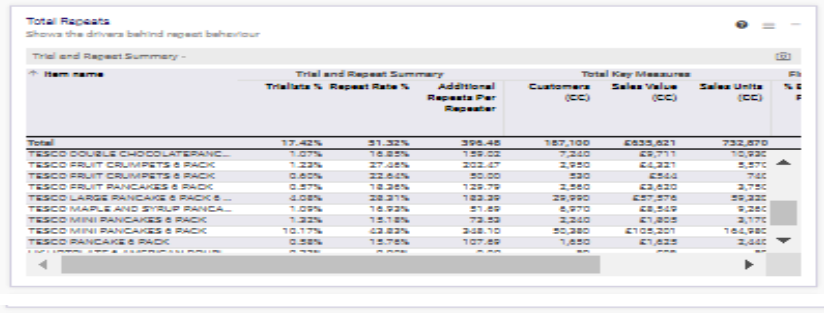
One of India’s reputed software and product development companies, approached ValueCoders to complete the task of migrating all its data reports from Adobe Flex to HTML. As Adobe Flex was about to be decommissioned in December 2020, the migration was required to shift the data to a more efficient & stable platform. The project's goal was to migrate crucial data reports from one platform to another while maintaining or improving the speed of data rendering. There were many reports; this one is the Repeat Purchasing report that displays how many times a product is purchased repeatedly, and then, according to the data, the team would make decisions.
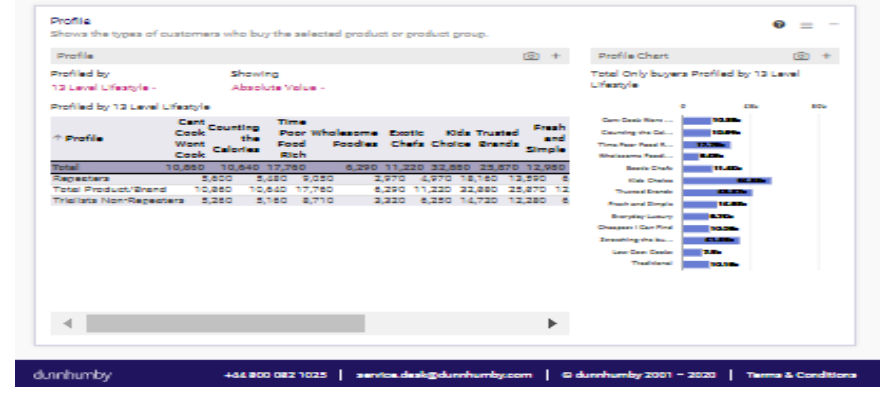
The website makes it possible for brands to analyze the data and provide customer feedback, revenue, and aging reports through better-optimized reports. This way, they can identify patterns or trends to make smarter decisions contributing to their company’s success.
The objective was to create new reports by using more effective technologies to make them perform better and easier to analyze.
Collaborating with ValueCoders, the client expected that the project would modernize the technologies and data analysis method. The client was looking for a more cutting-edge, innovative approach that would help better understand the target audience.
The registered user can view and search from the various reports listed on the platform.
Home Page/Landing Page
Following steps for the shop reports
Run the internal process for achieving the desired report results
Follow the following three steps:
We will write the console job to read the CSV file & transfer the data to SQLite as per the defined reports
| Key Challenges | How We Resolved |
| Initially, all charts were developed with Flask using HTML5 and CSS3. The rendering of the data was very slow. Even after applying filters, charts were taking too much time to load. | We advise converting these charts with Angular 9, Hi Charts, and D3JS using SQLite DB to manage all master data at the client site. |
| ETL and data warehouse processes were not in place, so report generation was taking time. | We implemented data warehouse techniques after writing ETL packages with MSSQL |
| No compression mechanism was applied on Web API with a large amount of json. No Cache and web DB were available. | We ignite Appcache and Azure data factory at the backend level. Logs are recorded in NoSQL. |
A team of experts in business analysis, design, and development came together to migrate crucial data reports from one platform to another to meet the needs of both clients and users while remaining profitable.
Business Goal – To discontinue the old technology and shift to a better, more advanced technology to speed up data analysis and decision-making. To harness the power of technology through which analysts can process data more efficiently and come to sound decisions more quickly. The client was looking to increase efficiency and save time and resources.
The solution is designed based on the best business approach by considering the client’s needs and objectives, as well as the company’s products and services. The result is a customized solution that meets the client’s specific needs.
Development Stage – We started the project by defining the product backlog along with ER diagram, sprint planning, and sprint review during the retrospective meeting.
We also manage daily standup meetings with the scrum team to get updates on tasks and find technical and functional hurdles.
The new table has turned out to be a faster and more effective way to render data. Even with millions of records, charts can display all analytics in seconds. Drag and drop features also added for managing customized dashboards. As a result, users get: